Thursday, October 29, 2015

Latest SSMS stream lines the process for adding Azure Firewall Rules at connection

If you haven't heard, Microsoft have broken the release of SQL Management Studio away from the main product. While at this stage it is continuing to be released at the same cadence as the SQL 2016 CTP 2 cycle (e.g. Monthly) the updates are targeting features for existing releases, Azure SQL, and of cause SQL 2016. You can get the latest release @ http://aka.ms/ssms.

I have been working on a project of late with an Azure SQL DB back-end and one thing that has always frustrated me given my role keeps me out in the field is that I am constantly having to log into the portal and update the firewall rules....... Well the latest release of SSMS makes this process much easier.

Now when you try and connect to an Azure SQL Server and a firewall rule on the server blocks your connection, you are no longer prompted with the message informing you that the client is not allowed to connect. Now you are prompted with a dialog asking you to log into Azure and create a firewall rule. It even populates the client IP Address for you and suggests an IP range.


One you authenticate, select the appropriate option for the Firewall Rule (e.g. static or IP range). Click OK and SSMS will place a call to the Azure web services to add the firewall rule.


Once the rule is added, the authentication process continues which is a nice touch because I was half expecting to be prompted to log in again.

 
 Obviously for this to work the user then needs the required permissions on the subscription

This is a great example of how the team is actively working on improving the toolsets and responding to feedback so make sure you keep the connect items rolling in.


In other news, I am presenting with a colleague at MS Ignite Australia next month on some of the new toolset features in SQL 2016. If your attending make sure you attend and come say hi as I will be around the Data Den and Exhibition hall throughout the event.

https://msftignite.com.au/sessions/session-details/1524


Legal Stuff: As always the contents of this blog is provided “as-is”. The information, opinions and views expressed are those of the author and do not necessarily state or reflect those of any other company with affiliation to the products discussed. This includes any URLs or Tools. The author does not accept any responsibility from the use of the information or tools mentioned within this blog, and recommends adequate evaluation against your own requirements to measure suitability.

Tuesday, June 30, 2015

SCOM: Sql Server Management Pack 6.6.0.0 released

The SQL Server Management Pack has been refreshed with all new dashboards, which look to be fully extensible and designed for larger server farms. Full details on how to configure the dashboards in the SQLServerDashboards.docx guide provided at the download links.

The new dashboards do look sexy though with these screen shots taken from the guides.


Version 6.6.0.0 can be downloaded at

SQL 2005-2012: https://www.microsoft.com/en-us/download/details.aspx?id=10631
SQL 2014: http://www.microsoft.com/en-us/download/details.aspx?id=42573

Again check out the specific guides provided on implementing these dashboards.


Legal Stuff: As always the contents of this blog is provided “as-is”. The information, opinions and views expressed are those of the author and do not necessarily state or reflect those of any other company with affiliation to the products discussed. This includes any URLs or Tools. The author does not accept any responsibility from the use of the information or tools mentioned within this blog, and recommends adequate evaluation against your own requirements to measure suitability.

Thursday, June 18, 2015

Announcing the release of my SQL Server DSC Resource Module mlSqlPs on PowerShellGallery and Github

I've been automating the installation of SQL Server components for 10+ years now so it's no surprise I am a fan of PowerShell and Desired State Configuration (DSC). Given my background in large, high volume, and diverse environments, the main objective I always think about is how the process can be easily replicated time and time again but also easily adapted to fit the needs of diverse configurations.

Unfortunately to date I have found the xSqlPs DSC module falls just short of these needs, but that was also the intent of the DSC Resource Kit Waves so that it would provide the "starting blocks" for organizations to customize and extend the resources. I had already started talking with the team about how to improve the SQL resources, but now that the DSC Resource Kit modules has been made open source on github this opens the door for the community to contribute into the standard set of resources. All changes I mention below are pending pull requests back into the main branch of the xSqlPs resource on Github.

The PowerShell Team is also working on their nuget gallery at PowerShellGallery.com, which is going to greatly assist with the new PowerShellGet feature in PowerShell 5.0. The gallery is still in preview however I am starting to contribute to it and this module will be available there (link below).


To provide these features to everyone straight away I have also launched my own version of the SQL DSC module called mlSqlPs. This will allow me to get changes out quickly, while also working to merge the best of my work back into the main branch.

Version 1.0.0.0 of mlSqlPs DSC Module provides the following resources and enhancements.
  • xSqlServerInstall - Enhanced
    Installs SQL Enterprise on target machine.
    This resource has been enhanced to provide capabilities for aligning to SQL best practices (e.g. Data, Log, TempDb paths)
  • xSqlHAService
    Enables SQL high availability (HA) service on a given SQL instance.
  • xSqlHAEndpoint
    Configures the given instance of SQL high availability service to listen port 5022 with given name, and assigns users that are allowed to communicate through the SQL endpoint.
  • xSqlHAGroupconfigures
    An SQL HA group. If the HA group does not exist it will create one with the given name on given SQL instance and add the HA group database(s) to local SQL instance.
  • xWaitForSqlHAGroup
    Waits for an SQL HA group to be ready by checking the state of the HA group of a given name in a given interval till either the HA group is discoverable or the number of retries reached its maximum.
  • xSqlAlias - New
    Configures Client Aliases in both native and wow6432node paths. Supports both tcp and named pipe protocols.
The module contains a help file in both HTML and MD format, as well as some Sample files.


You can get the module at the following locations:

PowerShell Gallery
https://www.powershellgallery.com/packages/mlSqlPs/

GitHub - Want to contribute let me know
https://github.com/matticusau/mlSqlPs


Are you running Windows PowerShell 5.0? You can also get the module with the new Install-Module cmdlet.
#Search for the module on the default gallery
Find-Module -Name mlSqlPs -Repository PSGallery;

#Install the module from the gallery
Install-Module -Name mlSqlPs -Repository PSGallery;


#Get the list of resources
Get-DscResource -Module mlSqlPs;


And there you go, create your configuration, push or pull the mof to the node and watch the magic.


Keep checking the GitHub repository and PowerShell Gallery for updates on this module.


Legal Stuff: As always the contents of this blog is provided “as-is”. The information, opinions and views expressed are those of the author and do not necessarily state or reflect those of any other company with affiliation to the products discussed. This includes any URLs or Tools. The author does not accept any responsibility from the use of the information or tools mentioned within this blog, and recommends adequate evaluation against your own requirements to measure suitability.

Friday, June 5, 2015

SCOM: Fixing a blank report list in Ops Mgr Console

Something I came across in SCOM 2012 R2 is that when users try and view Reports from the OpsMgr console wunderbar they could receive a blank list.


Possible Cause #1 - Incorrect SSRS file system permissions
One thing that can impact this is incorrect file system permissions on the SSRS installation location.

1. On the server where the SSRS instance is installed, navigate to the SSRS install folder. Depending on your environment this could be the default of the following or a custom drive:

C:\Program Files\Microsoft SQL Server\MSRS.\Reporting Services

Where is the numerical version of SQL (e.g. 11) and is the instance name. Such as \MSRS11.MSSQLSERVER\Reporting Services
 

In my lab I customised this to the root of a partition like:
D:\MSRS11.MSSQLSERVER\Reporting Services


2. Open the properties of /ReportManager and /ReportServer separately

3. Ensure that a group which would contain the Windows Accounts of the users trying to access the reports has Read & Execute permissions to the relevant folders.


This is from my lab where it is the default, you may choose to secure this back to a group(s) containing just the users granted rights to your reports but you need to ensure these permissions exist.


Possible Cause #2 - Corrupted identities
If you face this issue are you find that some users, or even just the SCOM Administrator, can access the reports but others cannot. This could be following a restore of the "Reporting" component or even a restore/migration/upgrade of the whole SCOM environment.

The key to understand the cause of this is to look at how both SCOM and SSRS configure security.

First access the Administrator section from the OpsMgr Console wunderbar, and view the User Roles. Open the properties of the Report Operator User Role which contains the users who receive a blank list. Click on the Identity tab.


Take note of the ID which is displayed. Copy this to the clipboard.... you will need it ;)

Now navigate to your Report Server url (e.g. http://localhost/Reports).
Click on the Folder Settings button from the home screen.


Here you will be shown the security of the reports. Check if the ID from earlier is shown, chances are your list will contain a different set of IDs.


IMPORTANT: Do not remove any role assignments

Click the "New Role Assignment" button.

Enter the ID into the "Group of user name" and select Browser, My Reports, and Report Builder roles.


Click OK

The security assignments should now contain the ID of your User Role from OpsMgr.


Now if you have your user refresh the Reports in Ops Mgr Console they should have access to the reports. At least that was the solution I found in my lab.


If you find other causes let me know :)


Reference articles/blogs:
Here are some other articles I have since found which provide troubleshooting guidance on this topic as well for your reference.

http://thoughtsonopsmgr.blogspot.com.au/2011/09/empty-reports-in-scom-whats-happening.html
http://thoughtsonopsmgr.blogspot.ch/2010/08/how-to-scope-scom-r2-reports-for.html


Legal Stuff: As always the contents of this blog is provided “as-is”. The information, opinions and views expressed are those of the author and do not necessarily state or reflect those of any other company with affiliation to the products discussed. This includes any URLs or Tools. The author does not accept any responsibility from the use of the information or tools mentioned within this blog, and recommends adequate evaluation against your own requirements to measure suitability.


Friday, May 29, 2015

SQL Server 2016: Query Store first looks

In case you missed the announcement SQL Server 2016 CTP2 preview was publicly announced today. You can read about it in the following post:

http://blogs.technet.com/b/dataplatforminsider/archive/2015/05/27/sql-server-2016-first-public-preview-now-available.aspx


There are already some training materials up on https://technet.microsoft.com/en-us/virtuallabs

The first new feature I noticed was a new type of actual query plan to include, Live Query Statistics.


When enabled the actual query plan is displayed as the query is executed, however it now also displays the real time progress as each stage of the query is executed. You can see this in the following screen shot where the Sort is at 65% (and subsequently all tasks after it are also at 65%). I wasn't fast enough to capture it before it reached the sort but it really does visually show you real time query execution. I'm going to have to find a really large workload to try it out on ;)


One of the new feature Query Store is one I have been "geeking out" on since earlier in the year and I am so glad I can now talk about it publicly and here is my first look at the feature first hand.

First off when you view the properties of a database there is a new configuration section of "Query Store" as seen in the following screen shot.


Before you can access this feature you need to enable it on each database. Like all data collection there is a small resource overhead but it's minimal due to the layer of integration so just enable it.... and given the product is in preview status should there be performance impact file a Connect Item and let the product team know.


So now you have enabled it you will have the ability to customise the data frequency, buffer hardening (flush), data retention/grooming, etc. Here are the defaults.

In my lab I have adjusted these values to be more granular, for the purpose of this blog, but you will need the find the sweet spot for your environment ;)

In the earlier screen shot of the database properties you can also see that there are graphical representations of the Query Store storage usage and a button to flush the storage if you need to.

Now if you refresh the database in Object Explorer you will see a new Query Store branch which contains some useful views.


These views offer some interesting data that previously we would have had to use extra tools to obtain.

The following shows the Overall Resource Consumption view.


Each of the views has the ability to be configured to adjust the metrics, date range, etc


The most interesting of the views in my opinion is the Top Resource Consuming Queries as this shows the top X queries on the top left box, and the query plans which have been used to return the results in the right top box.


When you select a "plan id" it displays the cached plan for that id in the lower pane.


Why is the so interesting, well like you can see in this screen shot I have had two plans for the same query. One with Parallelism and one without..... and from the bubble chart I can see which one has executed at times with the highest resource consumption and which has executed with the least resource consumption (based on my charts configuration). So from this data you can then make a choice if you should "force" a plan, or if you have forced the plan previously then you can 'unforce' it.


This makes all that effort of trying to figure out if a query plan has changed and is causing a degradation in performance, and then having to extract that plan and create the guide for it. Or many other changes in patterns of performance behavior.

Behind the scenes there is a great deal of data being captured about query execution to which we can access from a number of system tables.

For example on the table sys.query_store_query you can see the data around the internals of query times such as compilation time, parse time, etc.


I am definitely looking forward to exploring this feature further and all the time I am going to get back when looking into performance issue.

Obviously this is CTP2 and features/functionality will change before RTM.

Legal Stuff: As always the contents of this blog is provided “as-is”. The information, opinions and views expressed are those of the author and do not necessarily state or reflect those of any other company with affiliation to the products discussed. This includes any URLs or Tools. The author does not accept any responsibility from the use of the information or tools mentioned within this blog, and recommends adequate evaluation against your own requirements to measure suitability.

Thursday, May 7, 2015

SQL Server 2016 annoucement

SQL Server 2016 has been publically announced with the public Release Candidate coming in the American Summer. I will be using this post to collate blog posts and announcements regarding SQL 2016, and in particular the features which I am looking forward to.

SQL Server 2016 public preview coming this summer
http://blogs.technet.com/b/dataplatforminsider/archive/2015/05/04/sql-server-2016-public-preview-coming-this-summer.aspx


Query Store
http://slavasql.blogspot.com.au/2014/11/newest-sql-server-feature-query-store.html


Legal Stuff: As always the contents of this blog is provided “as-is”. The information, opinions and views expressed are those of the author and do not necessarily state or reflect those of any other company with affiliation to the products discussed. This includes any URLs or Tools. The author does not accept any responsibility from the use of the information or tools mentioned within this blog, and recommends adequate evaluation against your own requirements to measure suitability.

Sunday, April 5, 2015

SCOM: Customising the standard reports for greater presentation / functionality

Firstly I need to start by saying that it is not currently supported to modify the standard reports included in the core Management Packs. With good due diligence you should be able to prevent any accidental damage to the standard reports. The reason I mention the support factor is you would not be able to receive assistance from the Microsoft support team to achieve this. So make sure you use good development, test, and release processes for any of this work.

Now that has been established lets talk about why we might want to do this. Typically I have always created new custom reports from a SQL query that I already had or found online and I wanted to make the data either 1) easily consumed in a visual way 2) able to be automatically distributed. I was however faced with a very good reason by a customer recently and that was:
"Can we modify the standard built-in reports like Most Common Alerts so that the Report Parameters section is not included as it will contain a long list of Management Packs, or move that list to the end of the report. By having the long list of Management Packs at the start of the report we find report consumers (i.e. managers) were not seeing the value as they could not see the data as soon as they opened the report and had to scroll to page 3 or 4."

Now you could argue that it isn't much effort to scroll a page or two, but isn't the objective of a report to display data which is easy to consume. It is important to note that the Report Parameters being mention are part of a collapsible section which works in the report viewer, but when it is exported to PDF, Excel, etc it looses that dynamic capability and shows the values expanded.... hence the pages of data to scroll.

Another situation I can think of where this sort of modification might be needed is when you want to modify the way the data is visualized or add another visualization to the existing report. Now you can add parts from other reports into your report via linked reports.... but sometimes that just doesn't cut if for your needs.

Ok so onto the steps. I have broken the total process into the following phases, but have continued the step numbers throughout so you can follow where you are up to in the overall process.
Part 1: Designing/Creating Your Report
Part 2: Deploying Your Report
Part 3: Fixing the Report Parameters


Part 1: Report Design/Creation
1. Browse to the Reports web service
a) If you don't know the URL to your SSRS instance, in SCOM open Administration, Settings and the Reporting dialogue

2.  The reports will be stored in folders that represent the view you see under the Ops Console Reporting. Locate the folder containing the report you wish to modify. In our example we will use the "Microsoft ODR Report Library\Most Common Alerts". This report is found in the "ODR" folder within SSRS.


3. Something to be mindful of is that Linked Reports are used frequently within SCOM reporting. This means you may find the source report you are trying to edit is actually located in a different location. To identify if this is the case select "Manage" from the report menu.


Then within the details look for the "Link to" path. If this is present then you will need to locate that source report for the next steps. In my example the source report I need to locate is /Microsoft.SystemCenter.DataWarehouse.Report.Library/Microsoft.SystemCenter.DataWarehouse.Report.MostCommonAlerts.


4. Once you locate the report you wish to modify, download a copy of the report definition file (.rdl). There are two files for each SCOM report, we will explain the second file (.rpdl) later during Part 3. Download the .rdl file using the report menu.


5. Rename the file you just downloaded to a suitable name. This will be the name which eventually is displayed within SCOM, therefore following your organizations naming conventions is recommended (e.g. prefix the file name with your company name etc)


6. Open SQL Server Data Tools (aka Visual Studio), create a New Project of the type Report Server Project.


TIP: For simplified report development you can just use Report Builder, but due to the complexities and objects in the built-in reports I recommend using SQL Server Data Tools (aka Visual Studio with the Report Services templates).

7. From solution explorer right click Reports and select "Add > Existing Item"


8. Browse to the report file you downloaded and add it into your project. Open the report for editing.

9. Make the required change to the report layout. For our example we will remove part of the table which outputs the targeted objects, but the exact steps here will vary.


I've found in my case that this also left a blank space from the parent table, so I had to delete that row as well.

This whole step is all about report design and that skill is something far deeper than what I can go into in this blog, plus there are plenty of other blogs that cover the various techniques for designing report so I will stick to what you need to know for SCOM specifically.

10. Now that you have the layout of the report complete. You may find that if the report included any charts then there may be an area in the report showing "The custom report item type Enterprise.ManagementChartControl is not installed" such as in the following image.


This is because the SCOM reports are built with a custom charting control. While there are some blogs online that suggest methods for adding support for this control to your project, none of the information I found allowed modification to the chart. Therefore the easiest way I found to fix this is to replace the custom control with the standard Chart control which can be done with the following steps.

a) Delete the Enterprise.ManagementChartControl

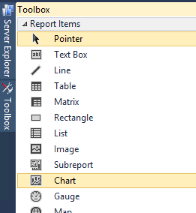
b) Add a Chart to the report from the toolbox


c)  Edit the chart properties and associate it with the appropriate data set.
d) Make further adjustments to the Series and Values as required for your purpose.

11. Now proceed to make all other changes to the report as you require. You can remove other components or add new tables/charts with new data sets too. Just look at the way the existing components/reports are created and follow that configuration. As I mentioned this is largely a Report Design process which is not unique to this topic so I won't go into any more detail here.

12. Once you have made all the changes you require to the report layout, save the .rdl file.


Now there is another critical step here which is to configure the Report Parameters which is covered in Part 3 and I typically perform that step now, however for this article we will come back and fix that after deploying the report so that we can demonstrate why it is required showing why. In the future though you may choose to perform Part 3 here and deploy both the RDL and RPDL files together.


Part 2: Deploying Your Report
14. Locate the .rdl file you just created in SQL Data Tools (aka Visual Studio).

15. From Internet Explorer, browse to the Reports web service as we did in the very first steps.

16. If you haven't already done so create a unique folder for your custom reports. This should follow a good naming convention. To do this from the Home path of the Reports server, click New Folder and follow the wizard.


17. Navigate to this new folder in the ReportServer

18. From the menu select Upload File

19. Navigate to the .rdl file you created and upload it to the report server. Correct the name if required, however if you have followed a good naming convention earlier then this should not be required.


20. Before you can view the report we must associate it with the Shared Data Source, otherwise you will receive this error:
The report server cannot process the report or shared dataset. The shared data source 'DataWarehouseMain' for the report server or SharePoint site is not valid. Browse to the server or site and select a shared data source. (rsInvalidDataSourceReference)

To correct this select Manage from the report menu (suggest using Detail View for this)


21. Select Data Sources and scroll down to the definition of DataWarehouseMain.

a) Check if it reports that the reference is no longer valid. If it does then click the Browse button

b) Select the Data Warehouse Main data source in the root of the report server. Click OK


c) When returned to the Data Sources configuration for your report, scroll to the bottom of the screen and select Apply.

d) Your report is now associated with the data source and ready to display data to the user

22. Switch to the Operations Manager Console. Select the Reports in the Wunderbar (left menu). Locate and select the custom report folder you created to hold your modified reports.


TIP: If you do not see the report folder you created, try Refreshing the Reporting view as I have found the console cache occasionally prevents it from immediately displaying.

23. You can now select your report and perform common actions on it like Saving to favorites, scheduling, etc


Part 3: Fixing the Report Parameters
You may notice that the when you view your report the report parameters are not as interactive as other SCOM reports. The other thing you may notice is that if you modified an existing report it all of a sudden includes all these unexpected parameters (particularly if you had to locate a Linked report). For example the following is the view of our modified Most Common Alerts report:


The reason for this is that SCOM uses custom report parameter components which are built into the SCOM Report Viewer control. Now the report is usable at this stage, but you need to know the precise values which are expected by the particular parameters for it to display accurate data. The following steps will outline how to correct this and configure the parameters for the best user experience.


24. Earlier in Part 1 step 4 we mentioned a .rpdl file, we now must locate that file for the source report, or if you are building a report from scratch then a report with a similar parameter values (note you would need to have configured the queries the same way too during your design of a new report for this to work but that is outside of the scope of this article).
a) So in our case we navigate back to the path in Step 4 and download the .rpdl file.

b) Make sure you save it with the same name as your report (e.g. FourthCoffee.Report.MostCommonAlerts.rpdl).


TIP: This rpdl file contains the definition for the Report Parameter Definition Language. It is this file which maps the report parameter to a custom control within SCOM.


25. You can edit the file in your favorite XML editor, however if you have based your report on an existing report such as in the case of this article, and you didn't make any changes to the Parameters during report design, then you shouldn't need to make any changes.

The following screen shots shows the layout of the unmodified MostCommonAlerts parameter definition file. You can see here how it binds the parameters by name to particular controls within the SCOM report engine.


26. Upload the RPDL file to the Report Server in the same location as your custom report (.RDL) from Part 2 of these instructions.

27. Switch back to your Operations Manager Console and reopen the report. This time, if your file is correctly defined, you will be presented with the typical SCOM Report Parameter controls.


NOTE: These controls only work within the SCOM report viewer, they will not display when viewing the report natively in SSRS Report Server (even if you can work around the authentication prompt! ).

28. Make any final changes to the report parameter definition file (.RPDL) to configure the parameters as required. It is through this file which you should be configuring parameters to be visible (by removing their definition), however you may need to adjust the parameter configuration within your report as well depending on the changes you make.


Reference Material
The following are some of the articles I used while figuring out this process.

Report parameters block
http://blogs.msdn.com/b/eugenebykov/archive/2007/06/15/report-parameters-block.aspx

How to change built-in OpsMgr performance reports to show data in a timeline - Part2
http://blogs.technet.com/b/daniels_opsmgr_blog/archive/2011/01/27/how-to-change-built-in-opsmgr-performance-reports-to-show-as-a-timeline-part2.aspx

Using Linked Reports in SCOM to Create Custom Availability Reports for Specified Monitors
http://blogs.technet.com/b/emreguclu/archive/2011/10/13/using-linked-reports-in-scom-to-create-custom-availability-reports-for-specified-monitors.aspx


Conclusion

That's it, you have now modified a built in report from SCOM. Most of the practices used in this guide could be applied to custom reports as well to further enhance their usage within your environment (such as the RPDL).

Happy report writing and please send me feedback if you use this guide or come across anything further which may need to be explored during this process.


Legal Stuff: As always the contents of this blog is provided “as-is”. The information, opinions and views expressed are those of the author and do not necessarily state or reflect those of any other company with affiliation to the products discussed. This includes any URLs or Tools. The author does not accept any responsibility from the use of the information or tools mentioned within this blog, and recommends adequate evaluation against your own requirements to measure suitability.